Kipu Health

The project and materials provided in this case were created entirely by me. The previous research materials (links before strategy) were provided by the contractee.

Methodology: Design Sprint

Methods Addressed: Map, Target, Wireframes, Documentation

Tools: G-Drive Suite, Figma

Deliverables: UX Strategy, Sitemap, User-Flow, Desktop & Mobile Wireframes, UX Documentation

If you would like to dig into the research provided by contractee, feel free to request access


Explore the Strategy


Handoff

Desktop/Large

Mobile/Small


Nidoo Web SaaS • Parking Provider

When leading the Product Design team (about 4) in this parking-ecosystem startup, I created, conducted and deliver everything from research to hand-off in this case. Initially the scope was to design the home-screen with a dashboard in mind, but I ended up redesigning the entire platform.

Deliverables: Interviews Analysis, Feature Map, Layout, Design Evaluation, UI Design

Methods: Stakeholder Interviews, Information Architecture, UI Design

Methodology: Design Sprint

Methods Addressed: Ask the Experts - Stakeholder Interviews, Learn through patterns, Map, Sketch, Prototype

Tools: G-Suite, InVision


Nidoo On Demand • Parking User

For this project, I led the Product Design team (about 4). The things I created involved, metrics plan and follow-up with dev and implementation, Research Plans, Analysis/ Mapping, Product Architecture (Site-Maps, User-Flows and Wireframes), User Tests, some of the UI (G-Map Skin, Micro-Interactions and Oboarding Lottie Animations)

Methodology: Design Thinking & Human Center Design

Methods: Stakeholder Workshop, Current & Future State Mappings, UX Metrics creation & implementation, Screening Plan, Research Plans, Design System, Micro-Interactions, G-Map Design, Motion Design, Cognitive Walkthroughs (User Tests for Validation), Stakeholder Interviews

Tools: G-Suite, InVision, Draw.io, Google Material Design, Adobe After Effects

Deliverables: UX North Star, UX Metrics, Screening & Research Plans, Research Analysis -Mappings (Current & Future) & Personas, Feature-Maps, User-Flows, Wireframes, Test Plans and Findings, Interview Plans

Nidoo_Mobile_OnDemand_V1 (2).png
 
 
Nidoo_Mobile_OnDemand_V1 (12).gif

Onboarding excerpt screens created with Adobe After Effects, Bodymovin & Lottie


Dondo Barter App

The entirety of this project was done by me. Through a Sprint-like methodology I took the brief given by the client, define a scope, identified assumptions, ideate through How Might We(s), chose a target and design hypothesis, establish success UX metrics from the proposed product, define Design Principles, mapped the Golden Path(s) for both platform roles, sketched and created the User-Flows. With Figma I created the wireframes displayed in this case. I also created a Research Plan for validating the design hypothesis based on the ‘Cognitive Walk-through’ -mediated method.

Brief


Debrief

Artboard 6.png
Artboard 7.png
 

Mapping

Artboard 9.png
Artboard 10.png
Artboard 11.png
Artboard 12.png
Artboard 13.png
Artboard 14.png
Artboard 15.png
Artboard 16.png
Artboard 17.png
Artboard 18.png
 

Sketching

Artboard 20.png
 

Userflows

Artboard 22.png
Artboard 23.png
 

Wireframes


User Testing Plan

Cognitive Walkthroughs

Artboard 27.png
Artboard 28.png
Artboard 29.png
Artboard 30.png
Artboard 31.png
Artboard 32.png
 

App Consejero Financiero

I was solely involved in the deliverables presented in this project. The closest methodology I aligned with is Design Sprints, were I de-briefed the given requirement through the 4 Jobs To Be Done provided and redesigned a financial advisor app. There was an initial app-evaluation, domain research, design hypotheses, Golden Path, Product Information Architecture and Mid-Fidelity screen-designs. The Mid-fidelity wireframes were delivered through Figma and Google’s Material Design system.

Brief

Artboard 4.png

Debrief

Artboard 6.png

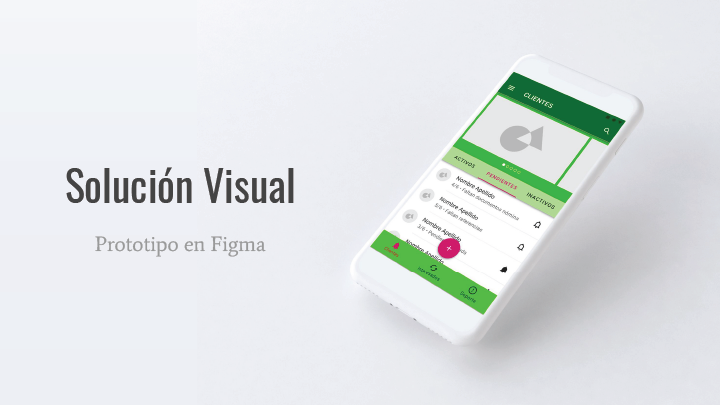
Entregable 1 — Solución Visual del Home

Entregable 2 — ¿Cómo se llegó a la solución visual?

Entregable 3 — Justificación del Proceso de Diseño

Diagnóstico Inicial – Evaluación de Principios Interactivos

Diagnóstico Inicial — Revisión Tecnológica

Hipótesis de UX

Mapeo

Arquitectura de Información

Financial Advisor App

Quick and dirty half a day exercise where I created everything. Through a very sprinted methodology I scoped the specific brief with the User Stories provided and translated these into a Golden Path (Future-State Map), a quick Feateure-Map and some Mid-Fidelity Wireframes.

Debrief

Objective:

“[C]reate an experience where advisors on our platform can log in to review and communicate with their clients.

Task: Advisor logs in, reviews a client and communicates with her/him

  1. Login

  2. Select Client, aggregate list view

  3. Browse Individual client view

    1. Info

    2. Call

    3. Message


Value Proposition

A platform that allows –advisors, keep track of current business and new  business (UpWork/Fiver), where they can communicate and collaborate / CRM –keep track of client journey (phase1, p2, etc)

What are we solving?

Easily create, track, contact, record, schedule and conduct a financial relationship with clients. Grow the business while delivering a great experience.

User Scenario

  • Advisor typically between age 30-50Paper/ Handwriting

  • Paper/Handwriting

  • Call / Email

  • Spreadsheets

  • Don’t know there are better possibilities

  • “Easier, faster & works”

  • Responsibilities: discovery for potential clients (gather information/ match and assigning profile with servicing tools/ communicating with client)

  • Help people (Altruistic, curious)

  • Not most tech savvy –Less is more


What does an advisor typically

  1. Says: What’s next (step, heard from…, why or not moving forward, followup)

  2. Thinks: Don’t know there are better possibilities

  3. Does: Tracking different things/ Looking towards how to help

  4. Feels: They feel they don’t have enough time/ They are doing enough/ Opportunities to hone into for follow-up questions

Best practices of advisor-client communication

  1. What are the most recurrent actions?

    1. Milestones on the process revolve around meetings

      1. Before and after (planning, what to cover, reports, follow-up questions)

  2. Which pain-points should we tackle?

    1. Breaking down miscommunication

      1. Missing/Late to next meeting

    2. Not knowing digital lingo/language

We should design for: Phone and text communication

  • Preferably iOS, iPhone X and beyond


Golden Path –Key Steps to reach Value Proposition

Golden Path.png

User Stories

  • As an advisor I want to easily log-in so that I can Skim & Scan clients list

  • As an advisor I want to immediately identify what is my next appointment so that I can either call or message the client

  • As an advisor I want to easily view which are my follow-up clients so that I can keep in touch through email or phone

  • As an advisor I need to record client’s general info (Name, financial goals, key facts) so that I can manage my client’s relationship successfully

  • As an advisor I need to track my client’s financial history with its corresponding financial goals so I can successfully advise my client

    • As an advisor I need to write notes whenever I am meeting my clients so that I can successfully track my client’s financial history

  • As an advisor I want to access my client’s contact info (phone and email) so I can easily reach them

  • [Reschedule]As an advisor I want to be able to reschedule so that any unexpected events can be properly handled

Design Hypothesis

  1. Quick and easy log-in with email or Google/Apple

  2. 3 tabs to organize clients (Day-to-day, Alphabetically, Per Phase)

  3. A ‘Client View’ should quickly communicate the financial plan and performance so far with a graph

    1. A plan can be divided into milestones

    2. Each milestone should have leads, budget and actions


Mid-Fidelity Design

Retirement Plans Bank Feature

Tools: G-Slides, G-MD Color Tool, Figma

Deliverables: UX Research & Analysis, Information Architecture, Wireframes, UI Design & Prototype

Methods: Challenge, User Research -Online, Competitive Research & Analysis, Design Hypothesis, Information Architecture (Tasks, User-Flow), Wireframes, UI Design.

 
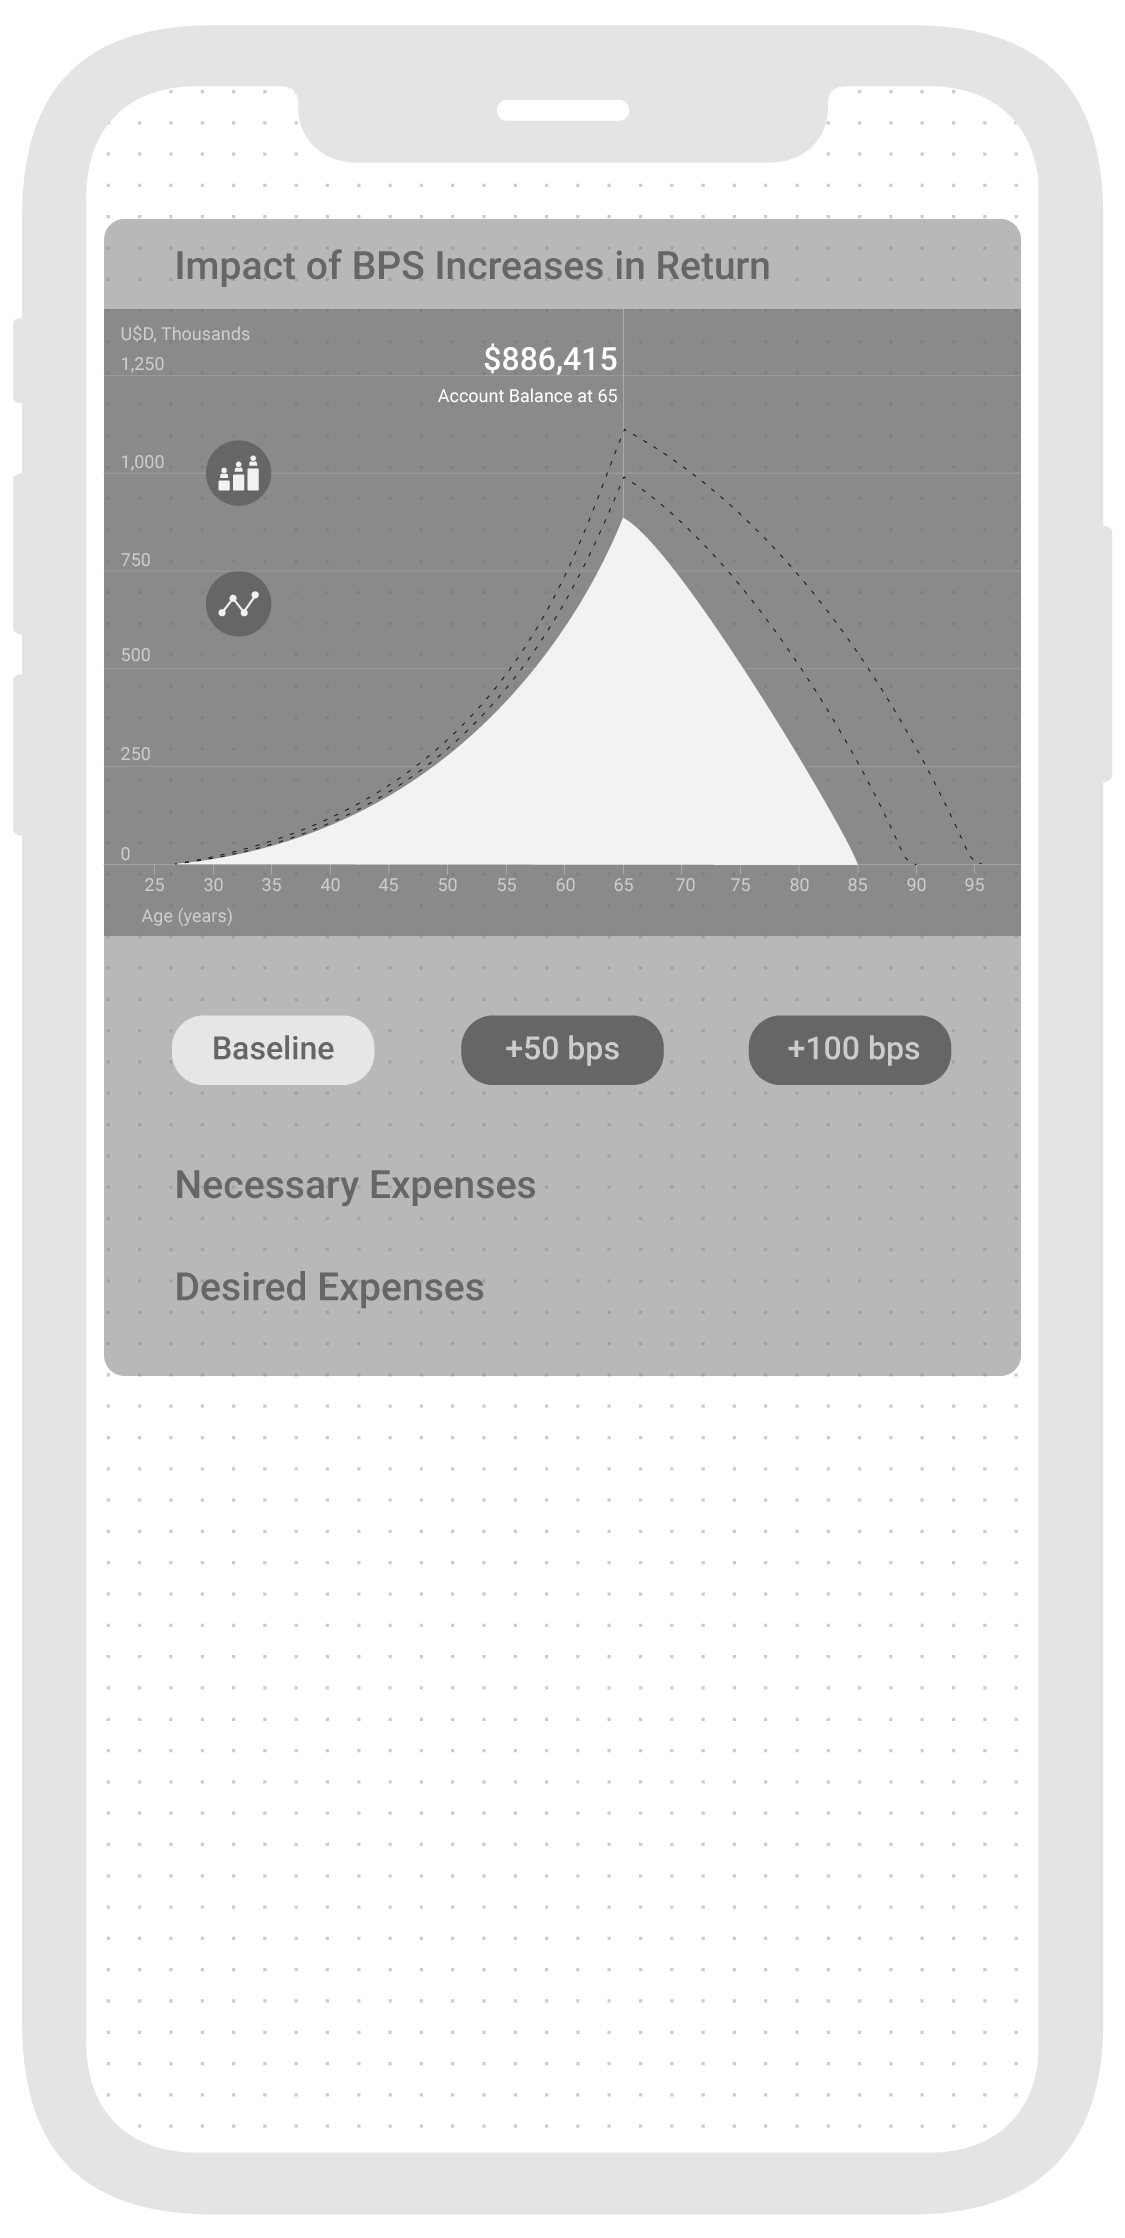
First screen from the Figma Prototype

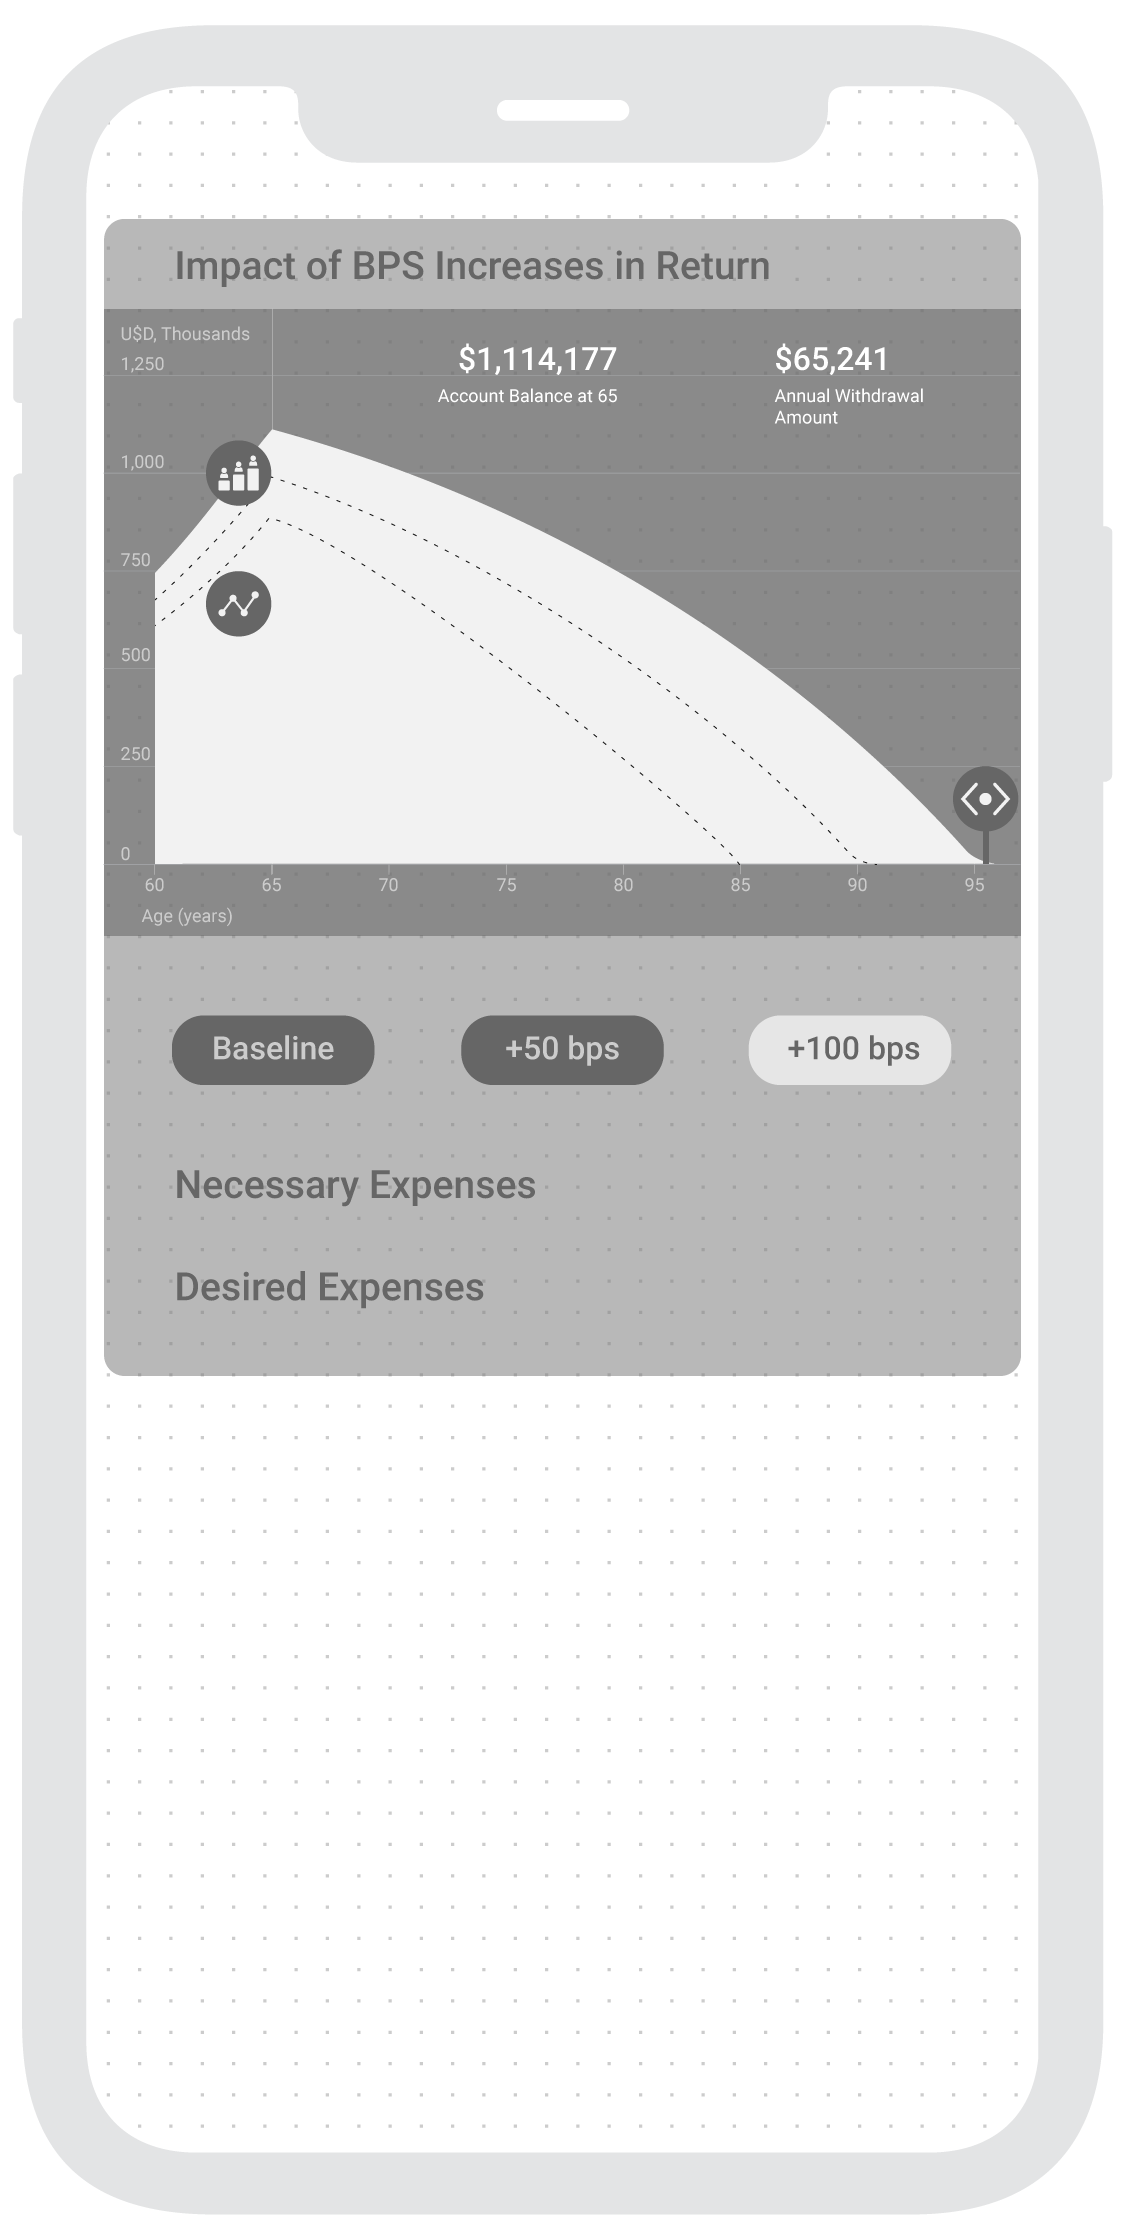
First screen from the Figma Prototype

Debrief

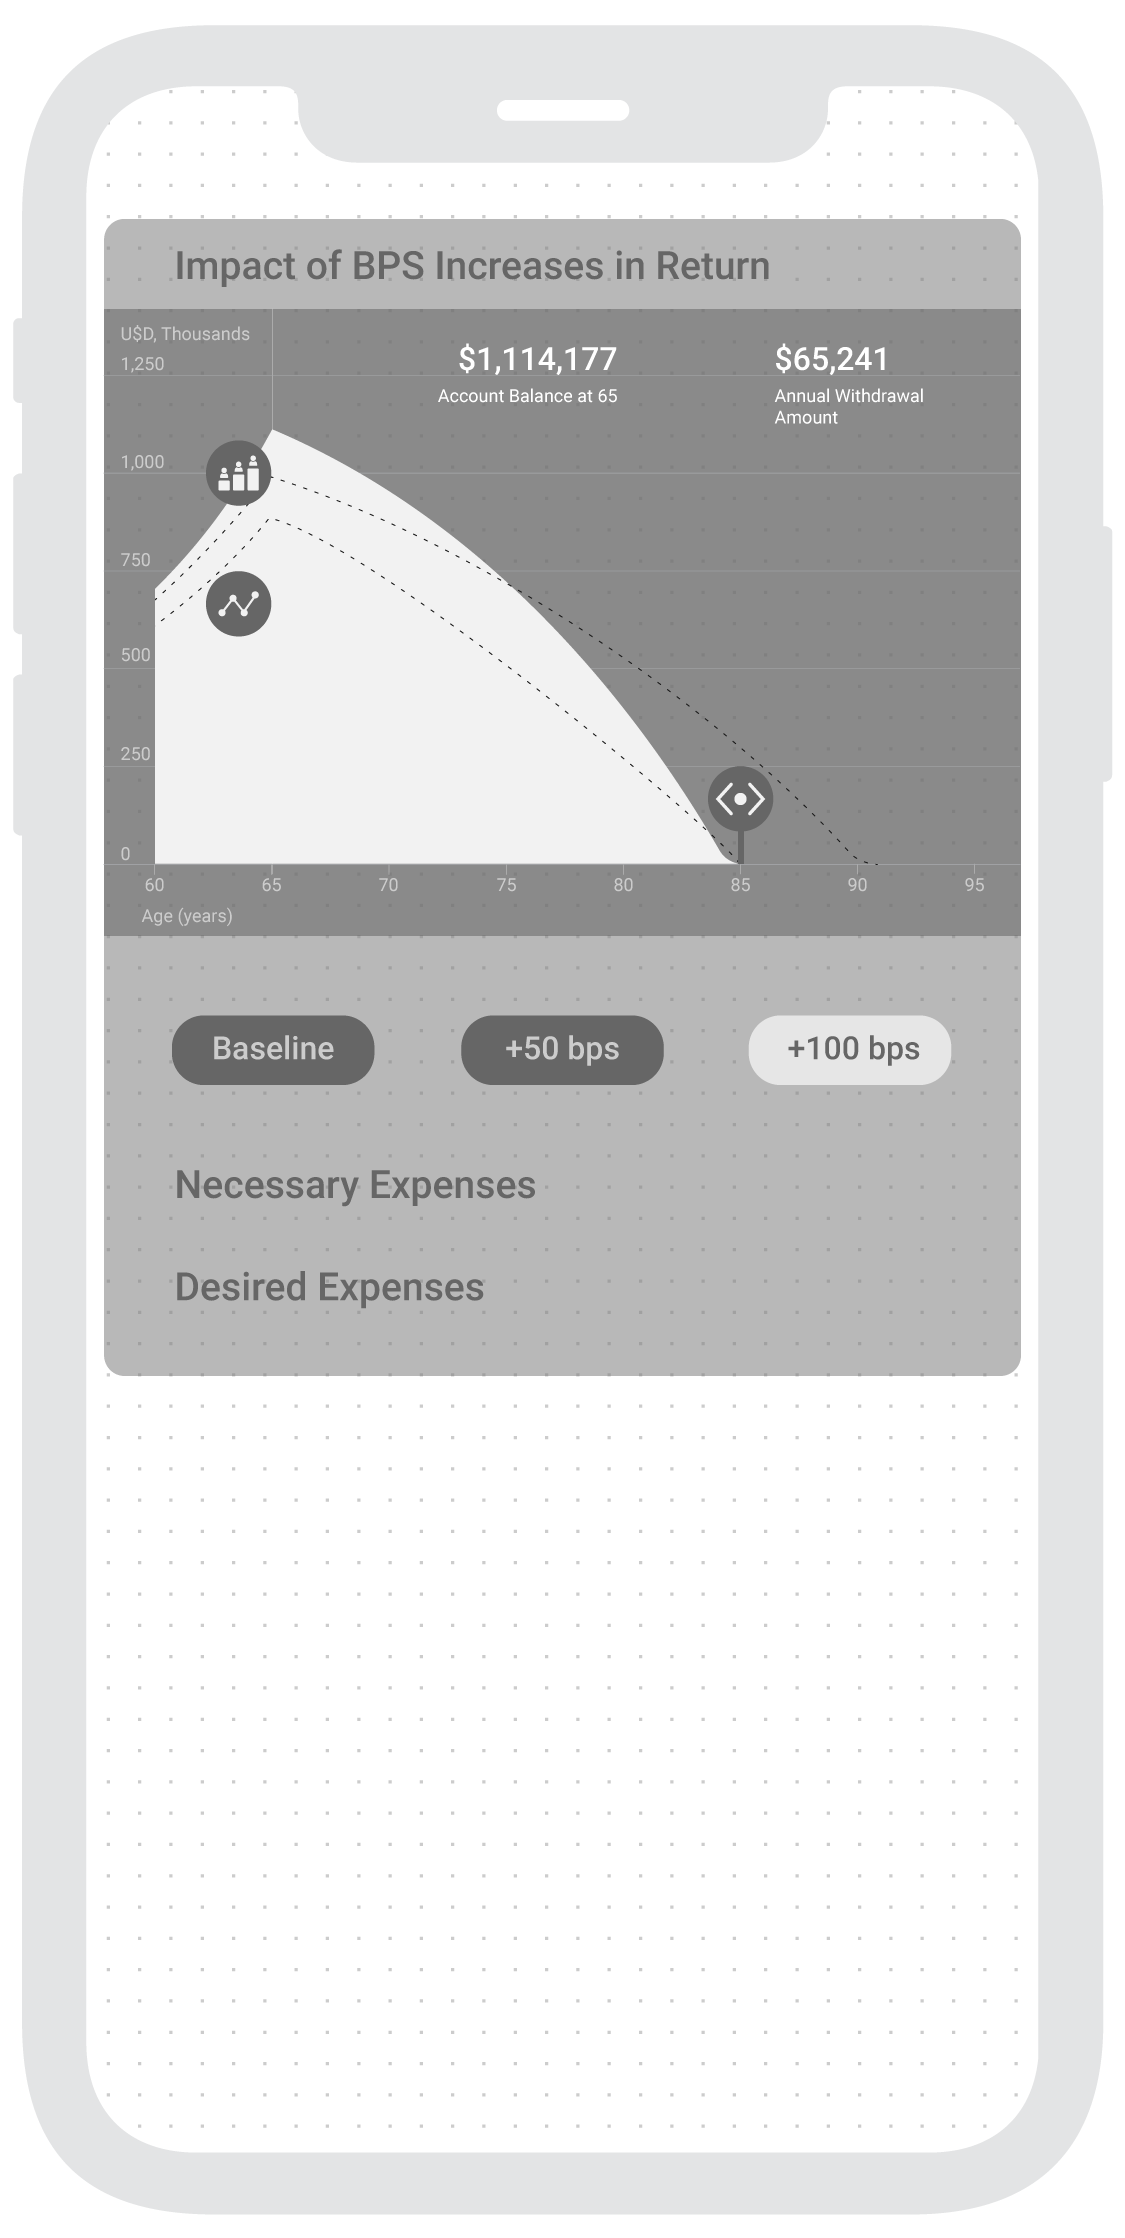
For a successful job opportunity test, I was asked to visually communicate the dramatic outcomes that can result from slight changes in BPS (Basis Points) –retirement plans, in an attractive intuitive and immediate way. This is what I came up within the 48 hour timespan. If you want to skip to the Figma Prototype.

Objective

Create a product that easily communicates the vast difference in results when there are slight changes in BPS for retirement plans.

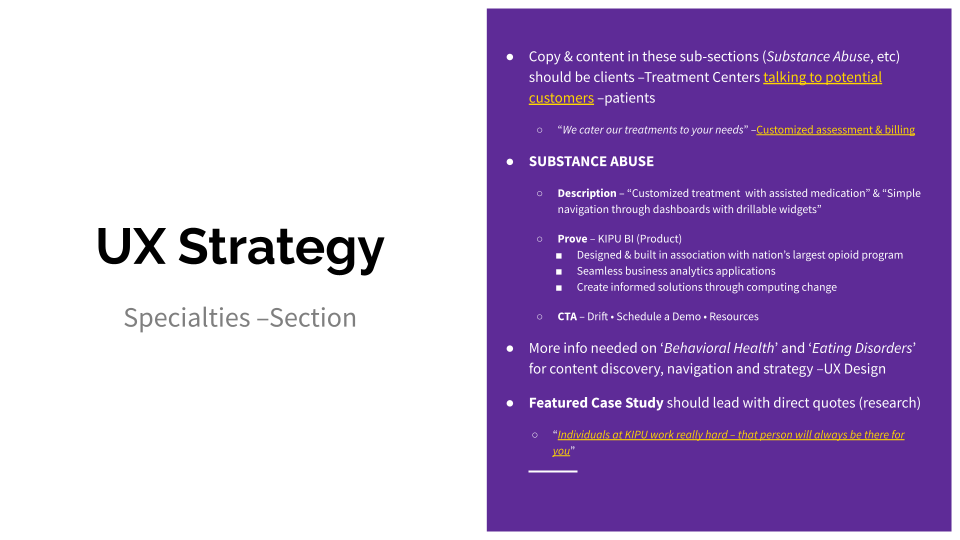
UX Strategy

Stakeholder’s Desire 

Our app should convey immediateness, attractiveness and intuitiveness .

UX Design Hypothesis 

Communicate how these dramatic outcomes translate into their lives.

Key Question: What do people care about/value when choosing retirement plans?

Investopedia

One of the most challenging aspects of creating a comprehensive retirement plan is striking a balance between realistic return expectations and a desired standard of living. The best solution is to focus on creating a flexible portfolio that can be updated regularly to reflect changing market conditions and retirement objectives.

3 Things Most Americans Want In Retirement And How To Get Them, Forbes

“First, people want to experience freedom from financial worries in retirement. This should not come as a surprise as 95 percent of respondents stated that freedom from financial concern is important to their definition of success in retirement.[...] 

Second, Americans want flexibility in retirement. Almost all respondents, 96 percent, stated that having the flexibility to do what they want in retirement is an important component to their definition of a successful retirement.[...]

Third, retirees want to spend time with family, to relax and travel as part of a secure retirement. For instance, 93 percent of the survey respondents stated that spending time with family was important for a successful retirement, 92 percent stated that relaxing was an important factor, and 80 percent stated that having the time to travel was crucial to a successful retirement plan.”


Competitive Research (Click here for more)

The Best Retirement-Planning Apps” by Kate Anania, Investopedia, Dec./19

Findings

  • “Acorns” Potential’ interactive simulation visually communicates simplicity, intuitiveness, attractiveness and potential impact in real-time

    1. With a vertical slidable graph selector, people can determine the time at which the simulation sets the ‘Hypothetical Projection’ in terms of the user’s age

    2. You can set another ‘Hypothetical Projection’ by selecting the “Change Your Potential” Button at the bottom

      1. Another graph emerges and results are shown comparatively, ‘Recurrent Periodic Investment’ and ‘Current

      2. People can choose an amount of set money values (intervals of $5 & $10) and the periodicity of such amount (Day, Week, Month)

      3. CTA "Turn on" button to activate “Recurrent Investment” feature, becomes very persuasive as you can perceive in real-time the vast difference from a small change

 
  • Mint” harnesses integrations with financial products and presents them in a way that is useful and insightful from a daily and planning perspective

    1. Simple UI with readable dashboards to have both a general understanding and details around spending and financial goals

    2. Extensive “Budgeting” categories 19 (75 subcategories)

  • Retirement Planner” Straightforward app with informative fields to have in mind

    1.  Ranked #1 in Investopedia, despite its poor Intuitiveness, Feedback and Visual Impact


Data Interpretation –from provided graph

  1. Visually the difference between the 3 BPS outcomes are not perceived as “dramatically different”

  2. Within an interactive environment such as mobile app, there's an opportunity where Data could be splitted, hidden and zoomed

    1. Setting “Demographic Assumptions” with defaulted values and embed them in an interactive component like a “collapsible list

    2. Scenario Assumptions” are the core of the simulation, so the three BPS buttons should always be visible

    3. Impact BPS Increase” give a general sense that withdrawal extends over time, but lacks meaningful possibilities for spending in hypothetical scenarios

  3. Why are “Annual Withdrawal Amount”(s) and “Withdrawal %” the same regardless of BPS?

    1. Assumption: The annual withdrawal amount is extended over more years

      1. What if people would rather spend more over less years? 

        1. What kind of expenses are relevant (amounts and timespan)?

  4. Are the years before retiring relevant when deciding a Retirement Plan?

    1. Assumption: Since its a static data representation, it can’t change view

      1. What if a closer “Retirement View” was presented? 

  5. Vital Info

    1. Account Balance at Retirement Age

    2. Annual Withdrawal Amount

    3. Other info can be shown when selecting corresponding item


Information Architecture

What is(are) the necessary feature(s) to accomplish the objective?

  1. Interactively visualize the dramatic difference in outcomes that can result from slight changes in BPS.

  2. Create a more dramatic view in the graph by zooming the X-Axis of Age. This will translate visually into a greater difference.

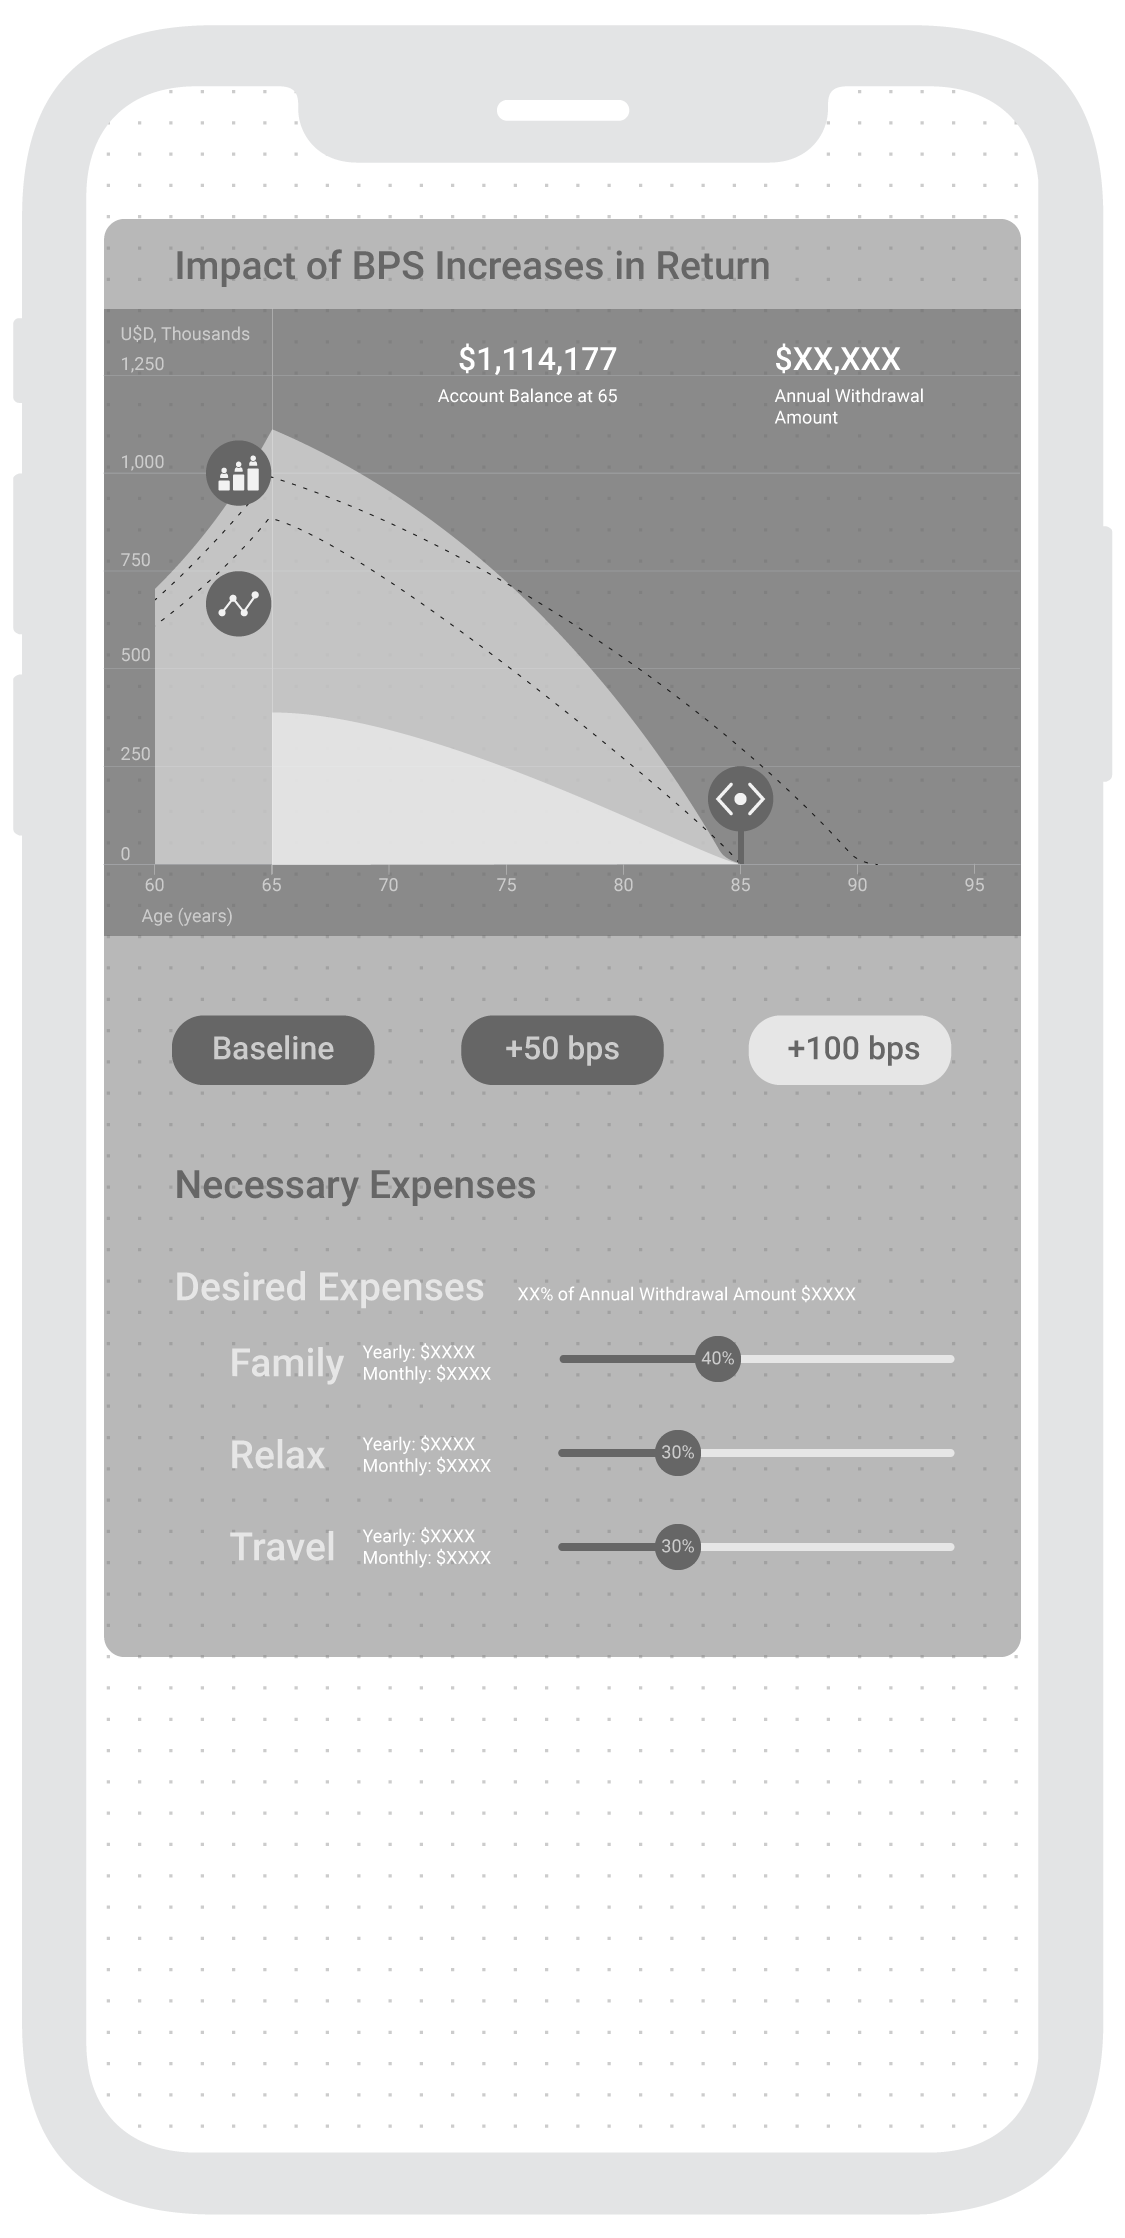
  3. Similarly, communicating how could these changes translate into meaningful retirement scenarios such as more available spending on family visits per year or month.


Outline

3. Relevant Expenses Section Shown in BPS Increases Graph when selected

  • Necessary (Yearly, Monthly, Weekly) [Fixed and correspond to selected General BPS value of Age]

    • Food

    • Health

    • Home

    • Bills & Utilities

    • Transport

    • Taxes & Fees

  • Desired (Yearly, Monthly, Weekly) [Slidable in Age, X-Axis]

    • Family

    • Relax

      Travel

  1. Intro Screen (Demographic Assumptions)

    • Starting Balance: $0

    • Starting Age: 30

    • Starting Salary: $40,000

    • Retirement Age: 65

  2. Impact of BPS Increases Graph

    • Account Balance at Retirement Age 65” (Visible when selecting type of BPS, default “Baseline")

    • Annual Withdrawal Amount” (Updates according to interactions)

    • Select BPS (Zoom to range from “Retirement Age” to “Life Expectancy”)

      • Account Balance at Retirement Age updates

    • Slide value -horizontal axis to choose a spending “Withdrawal Scenario Age” deadline in selected BPS (“Annual Withdrawal Amount” updates)


Wireframes

I have decided to take a mobile first approach, meaning the mobile app interaction will start from a phone layout since it is more widely used than tablets.

User Flow

2.WANDR_ABCcapital.jpg
 

Assumptions

I’ve decided to choose Mexico’s Bank “ABC Capital” since the American ABC Capital is a real estate company and the other ABC Capital is a Chinese Venture Capital whose website is in chinese.


Interface Design

I implemented Google’s Design Material since it presents a mobile OS agnostic approach for development.

Color

Screen Shot 2020-06-12 at 9.31.42 AM.png

ABC Capital’s brand colors include Blue (#00457D) and Red (#E62C38).

Using Material Design’s Color Tool as the starting point for managing color alternatives.

Both primary colors showcase a vibrant result when they are combined (low readability). This is why, following some color theory, I have composed three alternatives around the blue spectrum, with the primary brand’s color and the two variants created with this tool. 


Color Variations

Screen Shot 2020-06-12 at 9.45.25 AM.png
 

Figma Prototype

In this link.


Generative Soundscape Concept

When studying Interactive Technologies at NYU’s Interactive Telecommunications Program, I was working towards an interactive installation that blended the bowling gesture to trigger scattered half-spheres to generate a musical experience. This is an evolved and collaborative idea, from the Generative Sculptural Synth. The ideal concept is an interactive synthesizer that's made up of replicated modules that generate sound. It is triggered by sphere that creates chain-reaction throughout the installation's configuration.


Methodology: Iterative Concept and Prototyping

Tools: Arduino and Little Bits

Deliverables: Prototype of a modules that communicate and trigger through motion and sound range

It started out as re-configurable soundscape and evolve into an interactive –bocce-like– generative instrument. Here's a inside scoop of the brainstorming session were we –with my teammate– sought common ground. (1. Roy's ideal pursuit 2.My ideal pursuit 3.Converged ideal)

Audio Input Instructable

It started out as re-configurable soundscape and evolve into an interactive –bocce-like– generative instrument. Here's a inside scoop of the brainstorming session were we –with my teammate– sought common ground. (1. Roy's ideal pursuit 2.My ideal pursuit 3.Converged ideal)

Littlebits –whatever works–

After the slum dunk failure of the DIY Audio Input, I realize the convenience –limited– of prototyping with Littlebits. This way, I could start concentrating in the trigger event, rather than getting stuck at circuit sketching. I was able to program a simple timer for module to "hear" –boolean triggered by the microphone– and a timer for the module to "speak" –boolean to generate a tone–. What I learnt about the limitations of the Littlebit sensor is a twofold. They have a Sound Trigger and a conventional Microphone. Both bits' circuits have the embedded circuit solved out which turned out to be useful but limiting. The Sound Trigger has an adjustable Gain, an embedded –uncontrollable– 2 second timer and a pseudo-boolean output signal. So even though you can adjust it's sensibility, you can't actually work around with its values in Arduino IDE. The Microphone bit had an offsetted (±515 serial value) but its gain was rather insensible.

This is why, when conveniently using the Sound Triggers, the pitch is proportional to the distance. In other words, the modules are triggered closer when lower pitches are sensed and vice versa. However, since these bits –Sound Trigger– are pseudo-boolean, there can't be a Frequency Analysis.

Unisabana App

By mid 2014, along with Jenny Robayo and a team of students, we launched the official mobile application for Universidad De La Sabana. It was a creation process that involved a Human Centered Design approach and a semester of hard work. I was the Product Designer behind it, from UX Research to UI Development, good old generalist.

Methodology: Human Center Design

Methods: Focus Groups, Interviews, Stakeholder Prioritization, Design Principles, Personas, Wireframes, Mockups & Prototypes

Tools: Adobe Illustrator, Keynote, G-Suite

Deliverables: Research Analysis, Information Architecture, Screen Designs and Assets

From left to right, Rafael Rodriguez (Integration Lead), Ricardo Sotaquira (Information Technology Engineering Director and Project's Director), Francisco Ramirez (Design Lead), Jenny Robayo (Development Lead), Juan Pablo Velasquez (Student), Alejandro Zambrano (Student). Two students missing: David Piñeros and Nicolas Guzman

Even though this project involved NDAs, the overall process began with the core team (Director and Leads) drafting the Project's Proposal and Design Concept. After an agreed Brief with the stakeholders, we conducted User Research to validate our initial hypotheses and discover new opportunities. 

The video at the left is an excerpt from the User Research activities I conducted. They were held in the first Design phase, hearing our main audience, the student community.

Out of this research we crafted Design Principles that would guide us in the App's UX and UI. We also created personas that aided the scenarios.

By overlapping Needs from users and Desires from stakeholders, and the development team's Abilities we decided which features approach first. Once having everyone on the same page, I created tentative layouts through Wireframes and Mockups, that I translated later into tap-through prototypes.

We delivered a Mobile App with a set of features with breakthrough feature to encourage students to improve their performance (virtual academic advisor) and the campus community's daily activities (news, menu, events). The advisor is a tool that will suggest what should a student aim for his next graded assignment (exams, projects, homework) according to a desired course-grade.

This is a run through the different services, natively developed in iOS and Android available for download in their corresponding links

Interactive Dream Box

For children's month, we created a giant box to make a stronger bond between children and their parents. I was the Interactive Lead for this project making sure the hardware and software would run swiftly for a month and a half.

Methodology: Iterative Development

Tools: Arduino, OpenFrameworks

Deliverables: Interactive Experience triggered by levers and buttons that took children and parents through a journey
Concept

With a collaborative experience, people embarked in a journey in the world of dreams and imagination. To communicate children's boundless imagination and appropriation of everyday objects, we constructed a giant carton box as the ship, with two control panels were knobs and buttons are made out of plastic bottles and other every day objects. 

Technologies

Along with two Interaction Designers, we coded the project's software in OpenFrameworks and the hardware in Arduino. To ensure collaboration in the box's experience, both panels were made wide enough so they could only be triggered by at least two people. There are two starting knobs and two launching/landing levers. The other panel is as wide as the first one, and it has four buttons that light-up to a sequence. Lit buttons have to be pressed at the same time to defeat the violent thread in the journey.

Electronic Vote

In 2013 we created an electronic vote system through Android tablets that were remotely activated by a Laptop. I was the UI/UX Designer and Industrial Designer –Cubicle. Our main Design Challenge was to create an election system easily perceivable and predictable –intuitive– enough so grown-ups with no previous experience with mobile devices could vote. It was a successful system that didn't got in the way, with 93% of participation.

Storyboard

I created this storyboard so stakeholders could better understand the sought experience.

Scrutiny's visualization

For the scrutiny I developed this visualization in Processing

Enrutate iOS App

Back in 2013 with two developers, we created this Mobile App. I designed the UI including the simplified map of Bogota and the promotional motion graphics. It was the first Mobile Application to interact directly with the map. A more perceivable and predictableintuitive– interaction comparing it with the competition (public transport apps in Bogota, Colombia).